
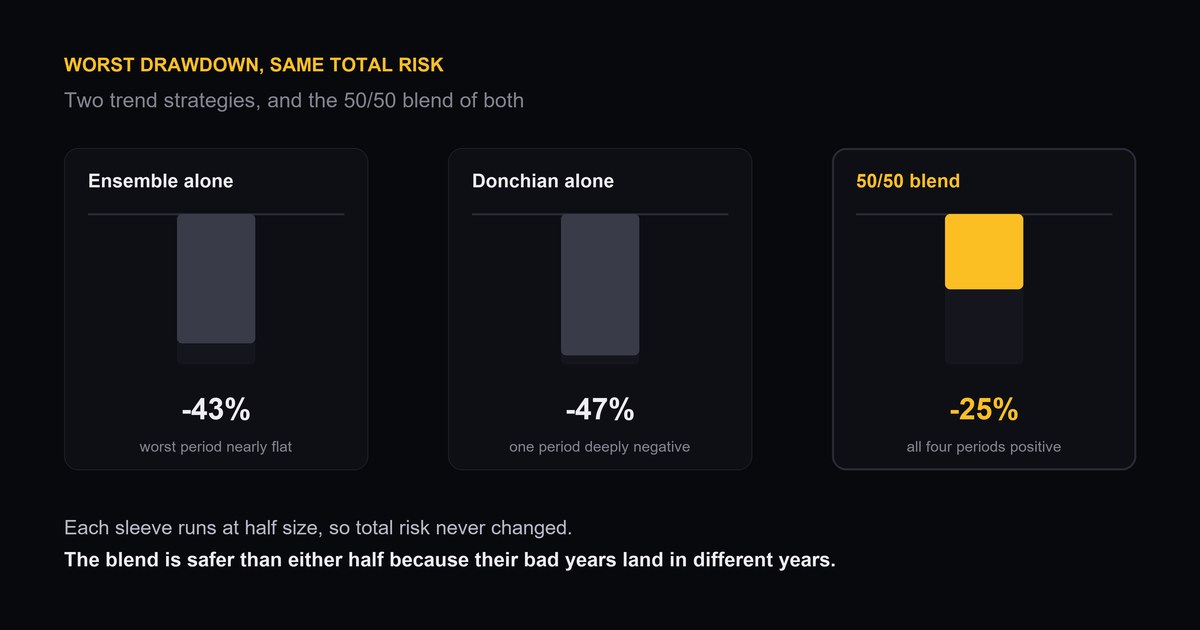
If you want a trading bot to lose less money, the obvious move is to make the strategy better. Tighten the entries, add a filter, cut the bad trades. I spent most of July trying exactly that, and every attempt either did nothing or made the out-of-sample numbers worse. The change that actually cut my worst-case drawdown by close to half wasn't an improvement to the strategy at all. It was adding a second strategy, individually worse than the first, running alongside it at half size.
This is Part 7 of the build-in-public series on my Binance futures bot. Part 6 covered risk sizing as a linear dial and closed with a promise to get into ongoing check-ins and a couple of dead ends. The dead ends turned out to be the setup for the more interesting result, so this post covers both: four strategies that failed, and the one addition that worked for a reason none of the four individual numbers predicted.
The book, before this change
Since Part 1 the live book has run one strategy per symbol: a trend ensemble voting between UT Bot and an EMA 20/50 crossover, filtered by an ADX regime gate that stands the whole thing flat in chop. Part 2's holdout test is what proved that ensemble actually generalizes rather than just fitting the coins I happened to design it on, and it's the gate every candidate below had to clear too.
As of July, every symbol runs two half-size sleeves instead of one full-size sleeve. Sleeve A is that same ensemble, now at half risk. Sleeve B is a plain Donchian n20 breakout: price closes outside a 20-bar channel, same 200-day EMA macro gate, same 3x-stop/6x-target ATR brackets as the ensemble, no signal-flip exit, it just holds to its bracket. Same total risk per symbol as before. Just split in half between two rules that don't fail in the same years.
Why Donchian, out of five candidates
Before landing on plain Donchian I screened five strategies total (the incumbent ensemble plus four new candidates) against the same test that mattered in Part 2: an out-of-universe holdout on coins that had zero role in picking anything. Four of the five failed it.
- Donchian with an added ADX gate: holdout positive-slot rate fell to roughly 54%.
- Donchian entry, UT Bot trailing exit: roughly 38% of holdout slots positive, the worst of the batch.
- 180-bar time-series momentum: holdout mean came in slightly negative.
- Three-rule majority vote (UT + EMA + Donchian): roughly 46% holdout.
Every one of those is a more sophisticated idea than "break of a 20-bar channel, no filter, hold to the bracket." Every one of them lost to it. Plain Donchian n20, the version with nothing added, was the best generalizer in the entire study: about 71% of holdout slots positive, and when I pulled a second batch of coins that had appeared in none of my prior research at all (fetched fresh, never screened on, never touched before this test), it held the same roughly 71% positive rate with the strongest mean of any candidate on that batch too.
My own incumbent ensemble, the strategy I'd been trading live for months and felt the most attached to, scored around 54% on both holdout sets. The strategy I understood best, and had tuned the most, generalized the worst of the two that survived.
The correlation nobody asked for
Here's the part I didn't go looking for. I wasn't screening candidates for how they'd combine with the ensemble. I was screening them for standalone quality, and Donchian just won on that basis. The complementarity showed up after I'd already picked it, when I plotted both sleeves' returns against each other by validation period.
The ensemble's worst period is a period where Donchian makes solid gains. Donchian's worst period, the one where it loses badly, is a period the ensemble handles fine. Their return correlation on the live three-symbol book comes out to roughly 0.66, high enough that they're clearly both trend-followers reacting to the same underlying moves, low enough that they don't sink in the same years.
That gap between "both trend-followers" and "both losing at once" is the entire value of the blend, and I want to flag honestly that I noticed it after the fact rather than predicting it going in. A pattern you find by testing a hypothesis deserves more trust than a pattern you notice once you're already looking at the results. This is the second kind. Worth remembering next time it looks too clean.
The numbers, as ratios
Same risk level throughout, four validation periods, the live three-symbol book. These are ratios and rates, not dollar figures, and the backtest caveats from Part 3 still apply in full.
| Configuration | Avg return | Worst drawdown | Periods positive |
|---|---|---|---|
| Ensemble alone | ~+61%/yr | ~-43% | 3 of 4 |
| Donchian alone | ~+57%/yr | ~-47% | 3 of 4 |
| 50/50 blend | ~+59%/yr | ~-25% | 4 of 4 |
Read the return column on its own and the blend looks like a rounding error, roughly tied with either strategy alone. Read the drawdown column and the blend isn't a compromise between the two, it's a different category of result. Worst-case drawdown drops from the low-to-mid 40s down to -25%, and for the first time in the study, all four validation periods come back positive. Neither individual sleeve managed that on its own.
The blend roughly ties the better of its two components on return while cutting worst-case drawdown almost in half. That headroom is what makes it possible to consider a higher risk-per-trade setting than either strategy could responsibly run alone, the other half of the Part 6 argument, from the drawdown side instead of the return side.
I chose 50/50 as the split, not some optimized weighting, because 50/50 is the no-tuning answer. Anything else would mean picking a weight based on which backtest window looked best, which is precisely the kind of after-the-fact fitting Part 2 exists to warn against. A weight I chose by eyeballing which sleeve "deserved" more allocation is a weight I chose using information the live bot won't have in real time.
Why this generalizes past this one bot
Ask the actual question instead of the comfortable one: why would combining two mediocre strategies beat spending that same effort improving your one good strategy?
Because improving a single strategy makes its wins bigger and its losses bigger by the same multiplier, the exact linear relationship Part 6 covers for position sizing. A better filter, a tighter entry, a smarter exit: all of it operates inside one return stream, and a return stream only has one set of bad years. You cannot filter your way out of the years your strategy's underlying logic is simply wrong for the market. You can only make the good years better and hope the bad ones don't come.
A second, uncorrelated return stream doesn't touch that problem, it sidesteps it. The ensemble's bad year isn't fixed. It's just not the whole book's bad year anymore, because Donchian is having a different year at the same time. Diversification between components did what optimization within one component never could: it removed years from the drawdown column entirely, rather than shrinking them.
None of this is a new idea. It's the same logic behind holding assets that don't move together in a portfolio, applied one level down, to strategies that trade the same assets but disagree about when to enter. What surprised me wasn't the concept. It was how much more it moved the number than any strategy tweak had in the two months before I tried it.
The honest caveats
The ~+59%/yr blend number is the selected-book optimistic case: it's calculated on the specific three symbols currently live, the ones that survived to be tradeable and interesting enough to include in the first place. Every universe I've tested against, including the "fresh" holdout batch, only contains coins that exist and have enough history today. That's a residual form of survivorship bias that no amount of holdout testing removes, because there's no honest way to test against coins that got delisted or never launched. I can control for selecting the coins myself. I can't control for the exchange's own listing history having already selected them for me.
Out-of-universe, across the broader holdout sets rather than the cherry three-symbol book, the realistic central expectation drops a lot, down into low-to-mid double digits per year once live execution costs get applied on top. The +59% figure is a real backtest output on a real configuration. It is not what I'm telling myself to expect from the live account, and if you've read the earlier parts of this series you already know that gap between backtest headline and honest live expectation is close to the one recurring theme of the whole project.
Four candidate strategies died against the holdout gate this month and none of them cost the live book anything, because none of them got past the test that was designed to catch exactly this kind of thing before it reaches real capital. That's the payoff of building the gate in Part 2 before I needed it in Part 7.
Next up, and this is the one I've been putting off writing because it's the least flattering: a change that looked correct from every angle I checked over 30, 90, and 180 days, and still failed the full validation. Full series is on the journey page, still posted in order, still nothing rounded up to make a chart look better.